The Market Rebound Puts SwanGuard On Edge

Considering the Fading Black Swan
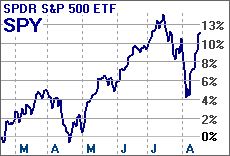
The recent Black Swan market event was triggered when a 5% market decline in late July was followed by a further sharp 5% decline in early August. The August selloff was triggered by the unwinding of the Yen carry trade when the Bank of Japan (BOJ) sharply raised its interest rate policy. A few days later when the BOJ softened its stance world markets rebounded in kind.
Since such punctuated events cannot be predicted, they must be endured and any profitable trades must come from the new trends it creates. SwanGuard is currently on the edge of reversing its status depending on what transpires with a set of technical indicators. If the market continues higher for another day or two the technical indicators will reverse SwanGuard’s status. However, if the market retraces downward, it will hold until some future time.
Unfortunately, the market is not a game of certainty. It is a game of finding ways to increase the odds of making more profitable selections while reducing the odds of incurring serious bear market damage.
When Risk is High Step Aside
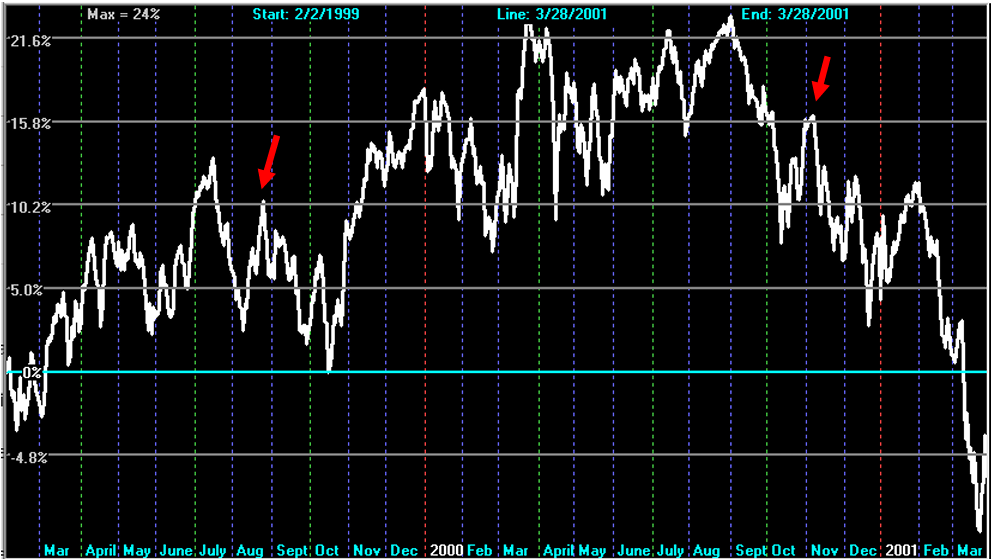
Please view this Market Commentary that I posted on SectorSurfer and AlphaDroid last Thursday afternoon. When risk measures are high, it generally means that the smart money is standing at the exit doors, waiting for another shoe to drop. You can bet they will be out the door before you can blink. Although the BOJ said it would move less aggressively, it doesn’t mean that its move was without just cause or is at all finished. Please also see my comments about the highlighted chart patterns (right) from 1999 to 2001 in the Market Commentary.
Knee-Jerk Momentum Anyone?
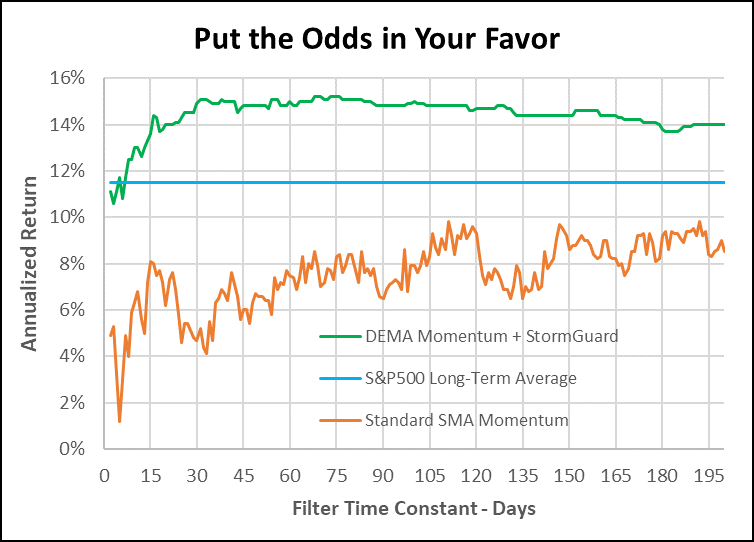
When the market starts swinging wildly it’s easy to imagine that some faster-responding set of momentum indicators might be able to make better decisions. Not so! Illustrated in the chart is the performance of two momentum strategies over a very wide range of momentum time constants. The orange curve is for a classic SMA (simple moving average) momentum strategy that trades between SPY and $CASH using SMA time constants from 2 days to 200 days. It significantly underperforms SPY (blue) across all averaging periods and does particularly poorly for short (knee-jerk) time constants.
The green curve is the performance using a DEMA (double exponential moving average) momentum strategy that trades between SPY and $CASH using DEMA time constants from 2 days to 200 days and further employs StormGuard. It typically performs 3% better than SPY buy-and-hold and 6% to 8% better than the SMA strategy.
Let’s Examine Risk and Return in Four Strategies
Below are four very different momentum strategies designed to illustrate the methods that work best to reduce risk and improve return. Unfortunately they do not include a crystal ball for predicting the punctuated events that turn markets.
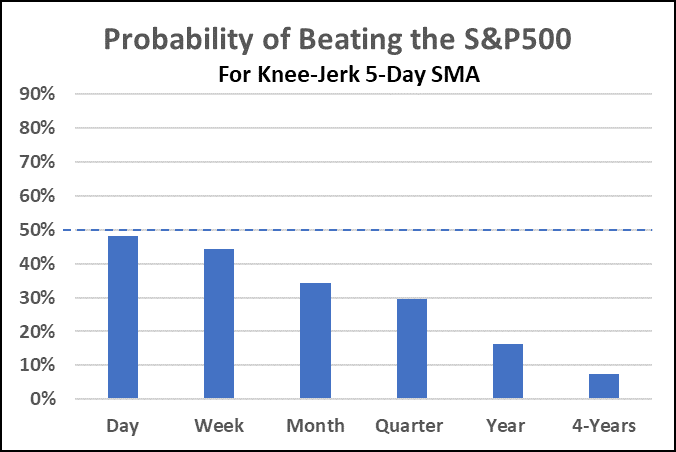
1.) Knee-Jerk 5-Day SMA
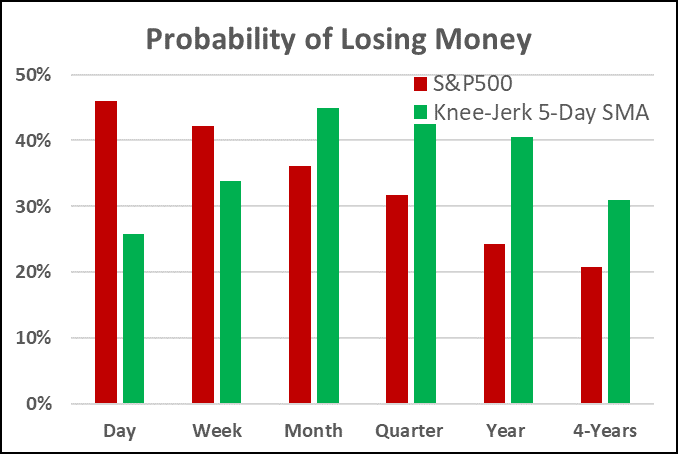
This Strategy employs a 5-day SMA momentum indicator and trades weekly between SPY (blue) and $CASH (red). It clearly illustrates that the 5-day SMA is a constant victim of whipsaw losses. While our visceral instincts tell us that the freshest information will produce better results, the opposite is the case. The blue bar chart confirms that over all measurement intervals, this strategy is a loser. The red/green bar chart confirms a high probability of losing money over any time interval.
2.) Standard Momentum + Death Cross
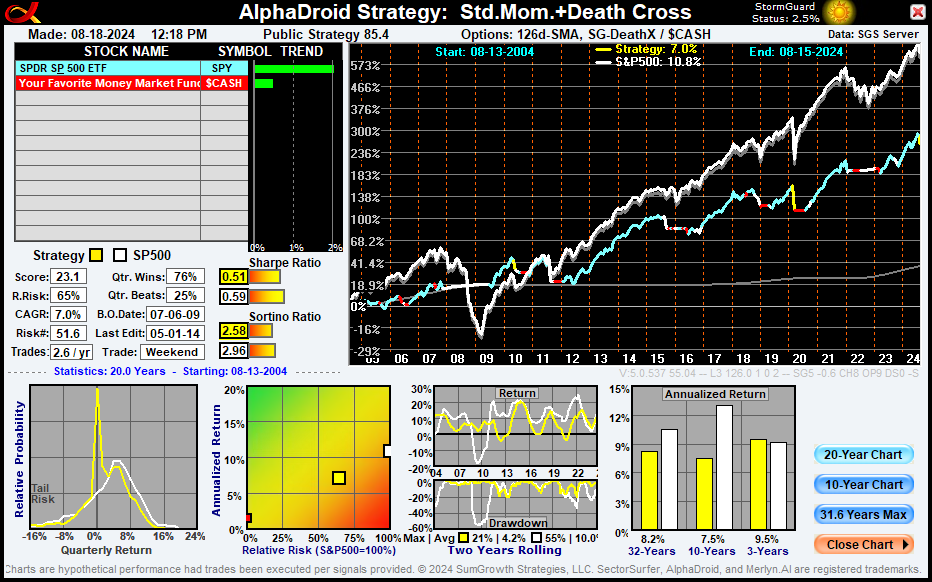
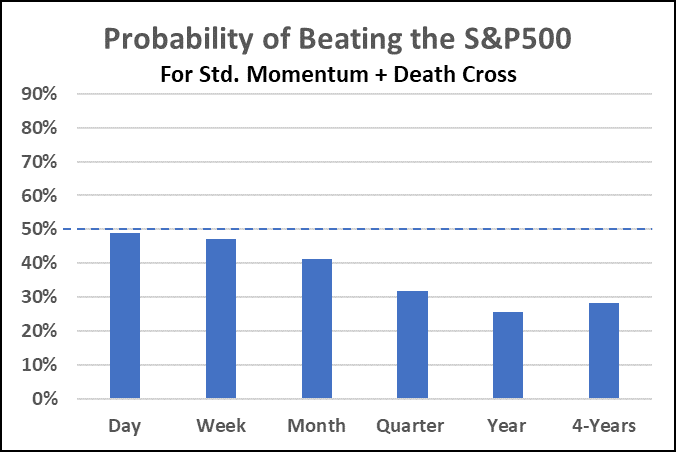
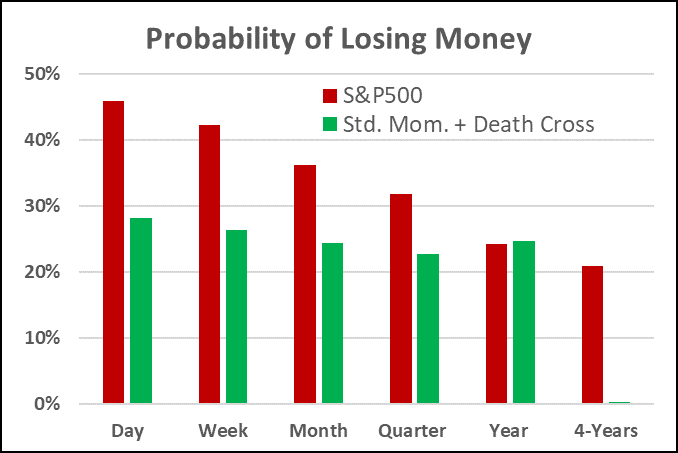
This Strategy employs the 6-mo. SMA momentum factor indicator to trade between SPY (blue) and $CASH (red). It further employs the Death Cross (50d/200d crossover) to exit to $CASH. While better than the 5-day SMA, it also is a regular victim of whipsaw losses. Its blue bar chart confirms that for all measurement intervals, this strategy underperforms SPY. The red/green bar chart also indicates a high probability of losing money over time intervals shorter than four years.
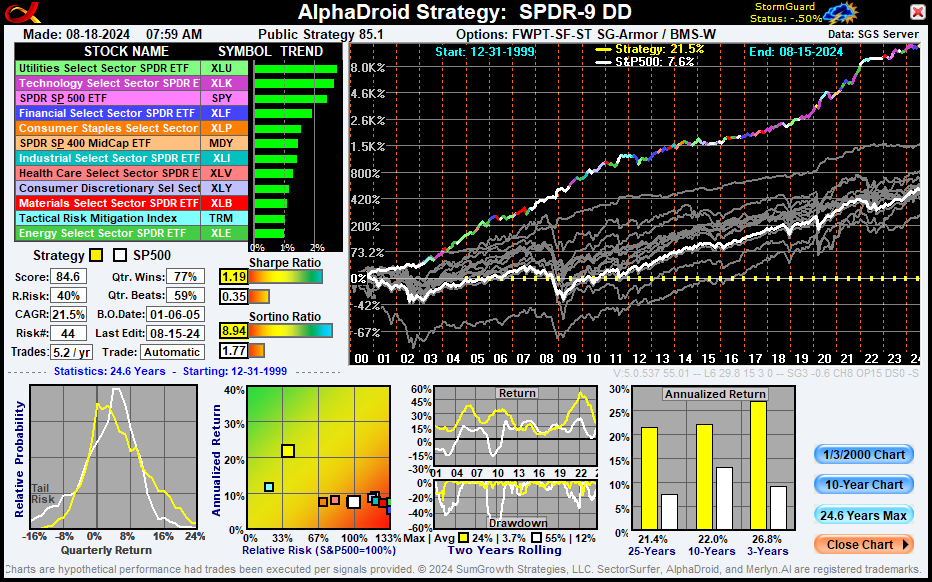
3.) SPDR-9 DD
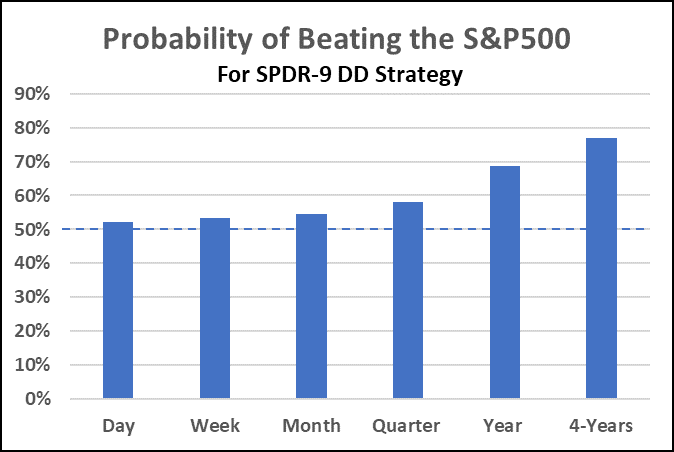
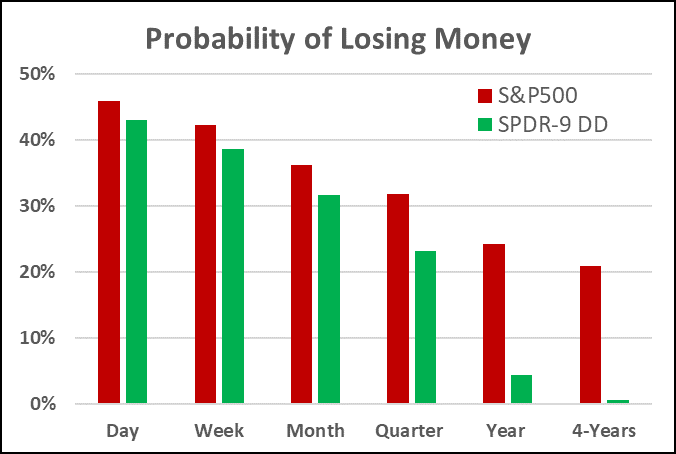
This Strategy employs our Forward-Walk Progressive-Tuning low-noise DEMA momentum indicator and StormGuard with bear market strategy BMS-W. It achieves nearly three times the return at 40% of the risk of the S&P500. Its blue bar chart indicates that for periods longer than one month, momentum trading contributes to making better selections. The red/green bar chart confirms this by the nearly complete elimination of losses over periods of one year or greater. This is the value of adaptive low-noise momentum.
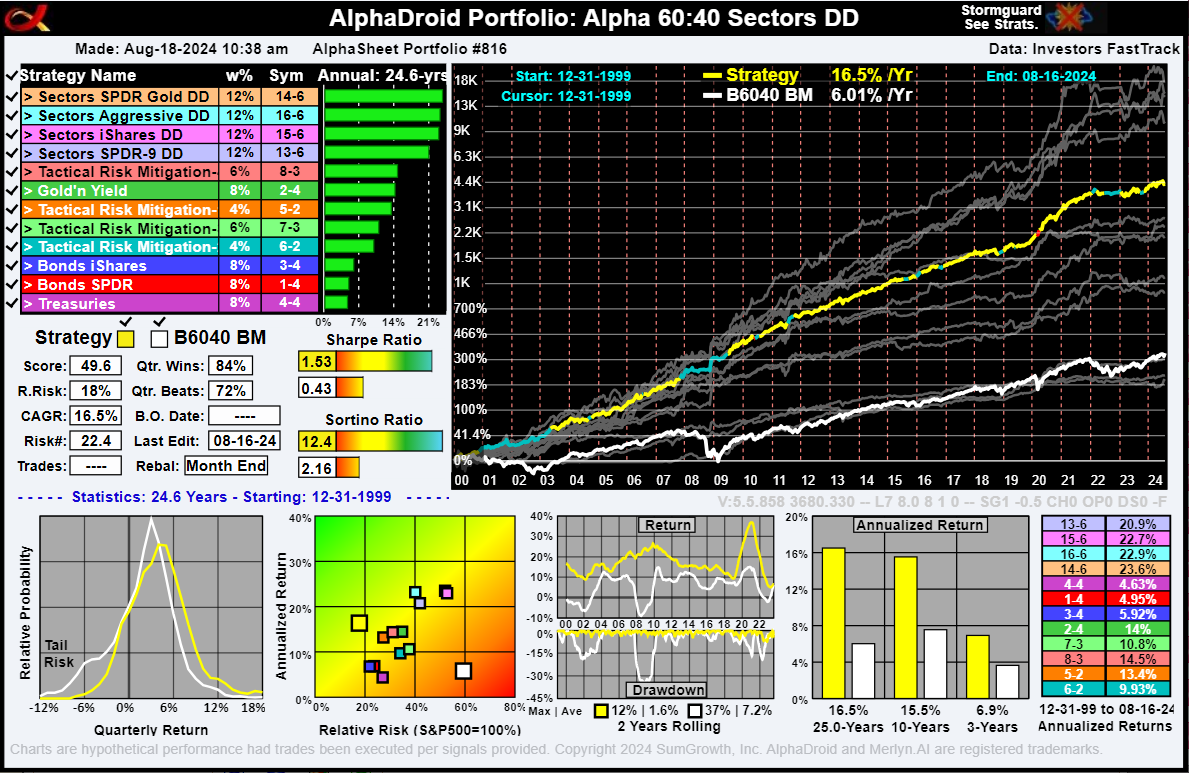
4.) Alpha 60/40 Sectors
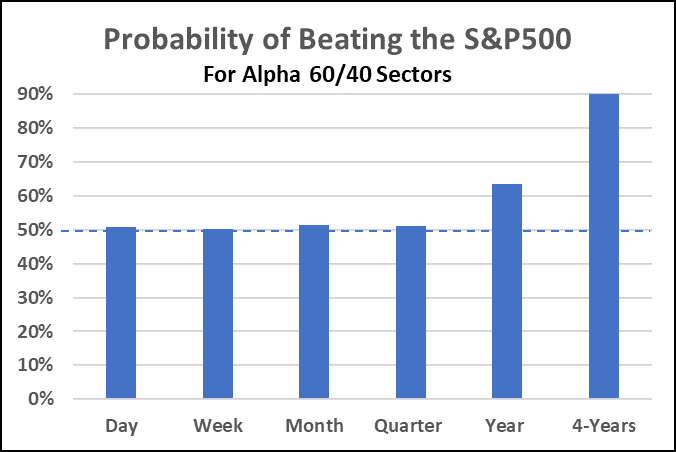
This is a Portfolio of Strategies that is similar in construction to the above SPDR-9 DD Strategy and is designed to achieve further risk reduction via the combination of multiple Strategies with generally uncorrelated equity curve perturbations. Thus, this portfolio naturally has the highest Sortino ratio and lowest drawdown of the four examples. Additionally, both of its bar charts are superior to any of the other three. But, if Strategy #1 beats Strategy #4 two months in a row, should you make a switch to Strategy #1? No!
Takeaway Points to Consider:
- If the market goes off the road, don’t remove your seatbelt until things settle down.
- Investment Strategies are best judged by their batting average, not by a single trade.
- Short-term market measures make poor trade indicators because of whipsaw losses.
- Punctuated events are random and must be endured. Profits come from trends they create.

Patience, not panic! Rules, not emotion!
May the markets be with us,
Scott Juds
Chairman & CEO, SumGrowth, Inc.
AlphaDroid Website
AlphaSheet Website
Questions?
Schdule an Appointment
SectorSurfer Home
AlphaDroid Home
Disclaimers:
Investing involves risk. Principal loss is possible. A momentum strategy is not a guarantee of future performance. Nothing contained within this newsletter should be construed as an offer to sell or the solicitation of an offer to buy any security. Technical analysis and commentary are for general information only and do not constitute a personal recommendation or take into account the particular investment objectives, financial situations, or needs of any individual. Before investing, carefully consider a fund’s investment objectives, risks, charges, and expenses, and possibly seek professional advice. Obtain a prospectus containing this and other important fund information and read it carefully. SumGrowth, Inc. is a Signal Provider for its SectorSurfer and AlphaDroid subscription services and is an Index Provider for funds sponsored by others. SumGrowth, Inc. provides no personalized financial investment advice specific to anyone’s life situation and is not a registered investment advisor. See additional disclaimers HERE.

