Introduction
Better bear market crash protection requires incorporating more information, not just tweaking the averaging algorithm or its time constant. All well-known market direction indicators use just a single source of data (usually the S&P500) as the basis for determining market direction. Metaphorically, watching one knee of an elephant to know if it's going to take a step has definite value. But, watching three knees provides superior information, allowing earlier detection and eliminating false positives. Likewise, StormGuard-Armor achieves superior performance by incorporating three sources of data to provide three distinct views of the market. Not surprisingly, StormGuard Armor has been quickly recognized as the industry's highest performance market direction indicator by individual and professional investors alike. Not only will it protect your assets during the next market crash, but when used in conjunction with a well-designed Bear Market Strategy positive returns can be generated.

StormGuard-Armor is a composite of three measures we call Price Trend, Market Momentum, and Value Sentiment. Its improvements do not come from trying to improve predictive timing, but rather from actual event detection. These are "tells" indicating behavior changes of momentum and value investors. The Market Momentum and Value Sentiment signals are extracted from market volume and new highs/lows data sources. Twelve separate measures of the Price Trend, Market Momentum and Value Sentiment signals are combined using the methods of "fuzzy logic" to produce the final StormGuard-Armor value. Even when applied to the S&P-500 (right), the improvement is clear.

SG-Armor Incorporates Event Detection, not Simply Timing Adjustments.
Most market sentiment indicators incorporate only measures of price change using one or more moving averages. Although there are many kinds of moving averages and many time periods over which they can be calculated, it is often the case that adjusting them to improve performance over one period of time results in reduced performance in others. Reacting more quickly generally results in additional whipsaw losses while reacting more slowly can result in going further over the cliff during a true market crash. The daily price record is limited in the amount of helpful information it can provide. In order to improve performance, additional information from other sources is required. Fortunately there are numerous measures of other market characteristics available, including daily volume, new highs and lows, advancers versus decliners and volatility. The objective is to find additional predictive information that can be used like "poker tells" to improve investment decisions.
StormGuard-Armor is the composite of three measures we call Price Trend, Market Momentum, and Value Sentiment. The Price Trend signal is essentially identical to the original StormGuard, which was derived from the application of Matched Filter Theory and performs measurably better than the classic 50/200 Death Cross. The Market Momentum signal further incorporates volume information, and may be thought of as a "tell" indicating that momentum traders are changing their behavior. Note that a Wall Street "momentum trader" defines momentum as daily volume times the rate of price change in much the same way as a physicist defines momentum as mass times velocity. However, ordinary trend followers generally mix the terms trend and momentum together by inherently ignoring the consideration of volume. The Value Sentiment signal incorporates new highs and lows information, and may be thought of as a "tell" indicating value investors are changing their behavior.

View A 5-Minute Demo Of Our Software
Start Your 30-Day Free Trial

It is important to note that the new Market Momentum and Value Sentiment signals are not just timing adjustments made in hindsight, but actually do provide signals prior to serious price movements. The first chart illustrates that during the market's rough patch in 2010 it was only the momentum signal that indicated trouble in the market. In 2011 during the run up to the August 1st sell off triggered by the S&P downgraded US debt, the Market Momentum signal again indicated trouble ahead of the event. However, in the second chart it is the Value Sentiment indicator that indicated trouble long before the August 2015 market drop triggered by trouble in the Chinese markets.
The improvements provided by StormGuard-Armor do not come about from trying to improve predictive timing, but rather from actual event detection. These are "tells" indicating behavior changes of momentum and value investors. The Market Momentum and Value Sentiment signals are extracted from the additional data sources using PID (proportional, integral and differential) control algorithms to condition them appropriately. The Price Trend, Market Momentum and Value Sentiment signals are then combined together using the principles of "fuzzy logic" to produce the final StormGuard-Armor result.
Best Bear Market Performance? Here's Proof:
The charts below illustrate the improvement provided by StormGuard-Armor over (1) owning only the trend leader, (2) Betterment's 60/40 stocks/bonds portfolio, or (3) simply owning the S&P500 index. Click the charts for details. To reasonably compare AlphaDroid's performance to Betterment and the S&P500, a Strategy was constructed holding only six ordinary largecap and midcap ETFs (SPY, SPYV, SPYG, MDY, MDYV, MDYG) along with the aggregate bond ETF AGG. The Strategy for owning only the trend leader has StormGuard disabled and the algorithm simply selects the best trending of the seven ETFs at the start of each month. When StormGuard-Armor is enabled, the Strategy is restricted to owning AGG during bear markets. While the 60/40 stocks/bonds split helps reduce Betterment's Max Drawdown and marginally improves its Sharpe Ratio (a measure of average return/volatility), it does so at the cost of lower returns.

HAVE QUESTIONS?
Market Sentiment/Direction Indicator Comparative Performance
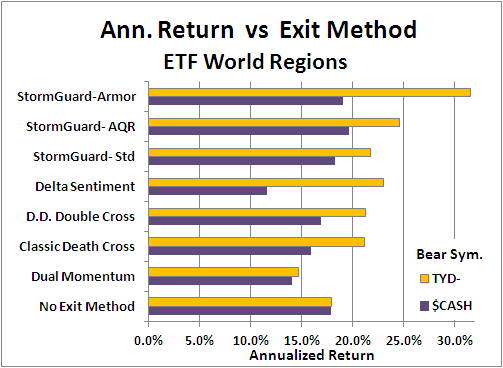
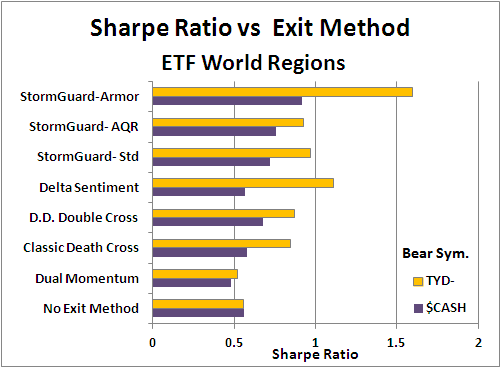
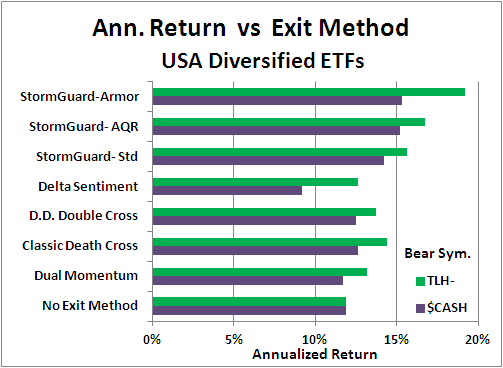
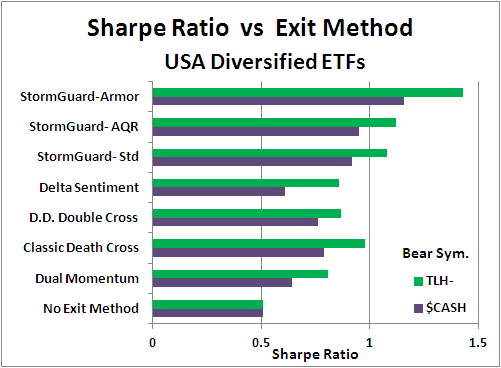
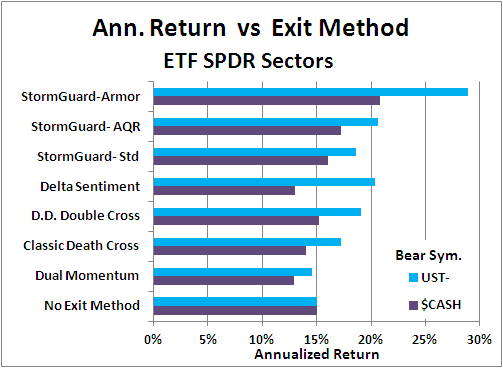
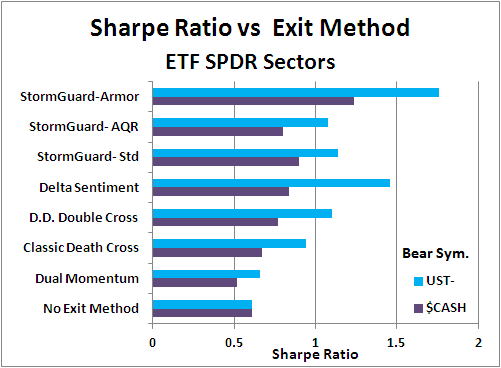
In the table and charts below, the performance of seven market direction indicators is evaluated for each of three major classifications of ETFs (broadly diversified, US sectors and world regions). The market direction indicator determines whether it is a bull market (risk-on) or a bear market (risk-off). During a bull market the Strategy selects the trend leader to own at the end of each month from among the Strategy's candidate ETFs. During a bear market, the Strategy will either move to the safety of CASH or alternatively own a long-term treasury ETF, depending on its configuration. Performance for both of these Bear Market Strategy configurations is detailed below. Please review the Bear Market Strategies page for a discussion on how hindsight selection bias can be avoided during bear markets using a well-designed Strategy that selects from a diverse set of asset classes that often (but not always) do well during a market crash. Protect your assets in the next market crash with StormGuard-Armor â€" it sets the standard for market crash protection!
US Diversified ETFs Strategy
True Sector Rotation Strategy using IVE, IVV, IVW, IWB, IWV, RSP, SPY, SPYG, MDYG and MDY. (TLH bear symbol)
ETF SPDR Sectors Strategy
True Sector Rotation Strategy using XLE, XLF, XLK, XLI, XLP, XLV, XLY, XRT, XHB, XPH, MDY and SPY. (UST bear symbol)
ETF World Regions Strategy
True Sector Rotation Strategy using DGT, EEM, EFA, EPP, FEZ, IEV, ILF, IOO, MDD, MDY, SPY and QQQ. (TYD bear symbol)